Quinn Dyer.
NYU Stern Student
“Poor is the mind that always uses the inventions of others, and invents nothing itself.”
Hieronymus Bosch — quote source, opens in a new tab
I’m Quinn, an undergraduate at NYU Stern. I’m interested in finance, economics, psychology, and building things.
Find me here, or send me an email.
Links will be added here.
Global Supply Chain
I built this for Infotech and took it further than the assignment asked. It won my class’s Tableau dashboard contest and earned me three bonus points (5% extra) on Exam 2. I used toy data to connect suppliers, customers, and sales offices through global trade routes.
Explore the data
AI-assisted browser recreation · October 2026. Try the dashboard below: it uses the original toy data and workbook calculations, and runs in your browser.
Original Tableau work

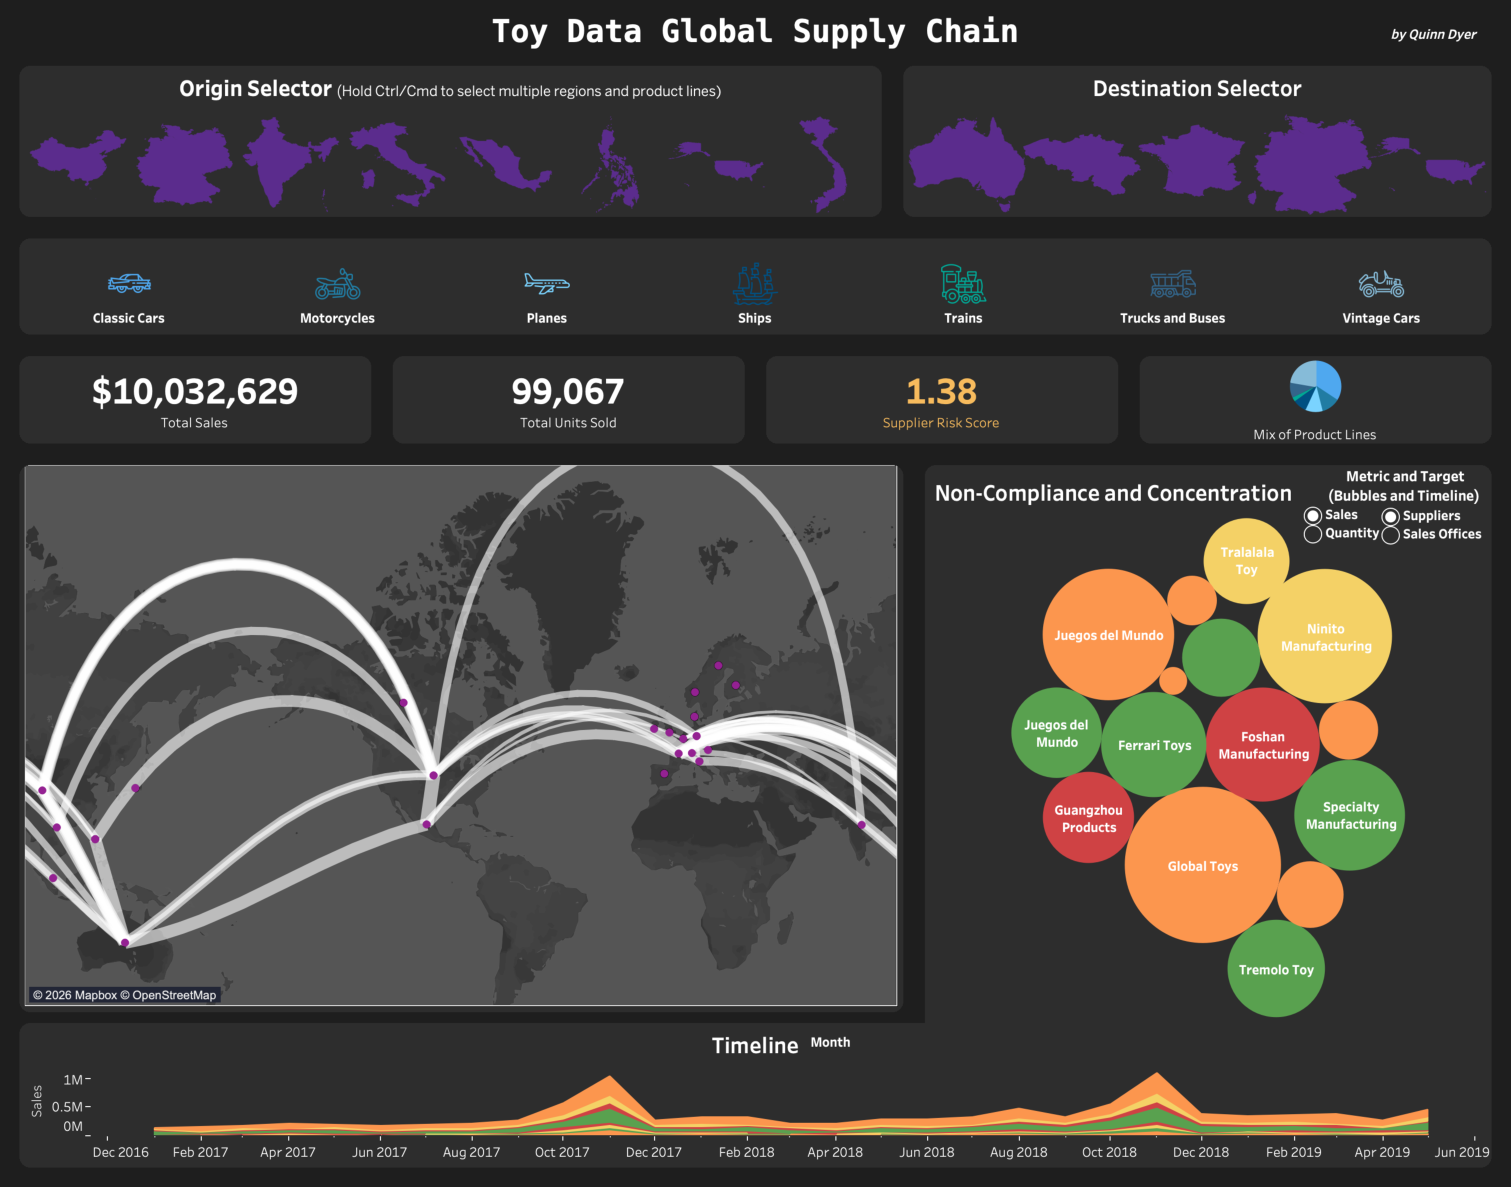
I made the original Tableau workbook without AI. The badge refers to that work; the browser recreation above is AI-assisted. Country and product filters connect the map, supplier and office bubbles, and sales timeline.